18 Oct 2026
Decoding Roulette Probability Structures and Links to UK Scratch Card Retention Data
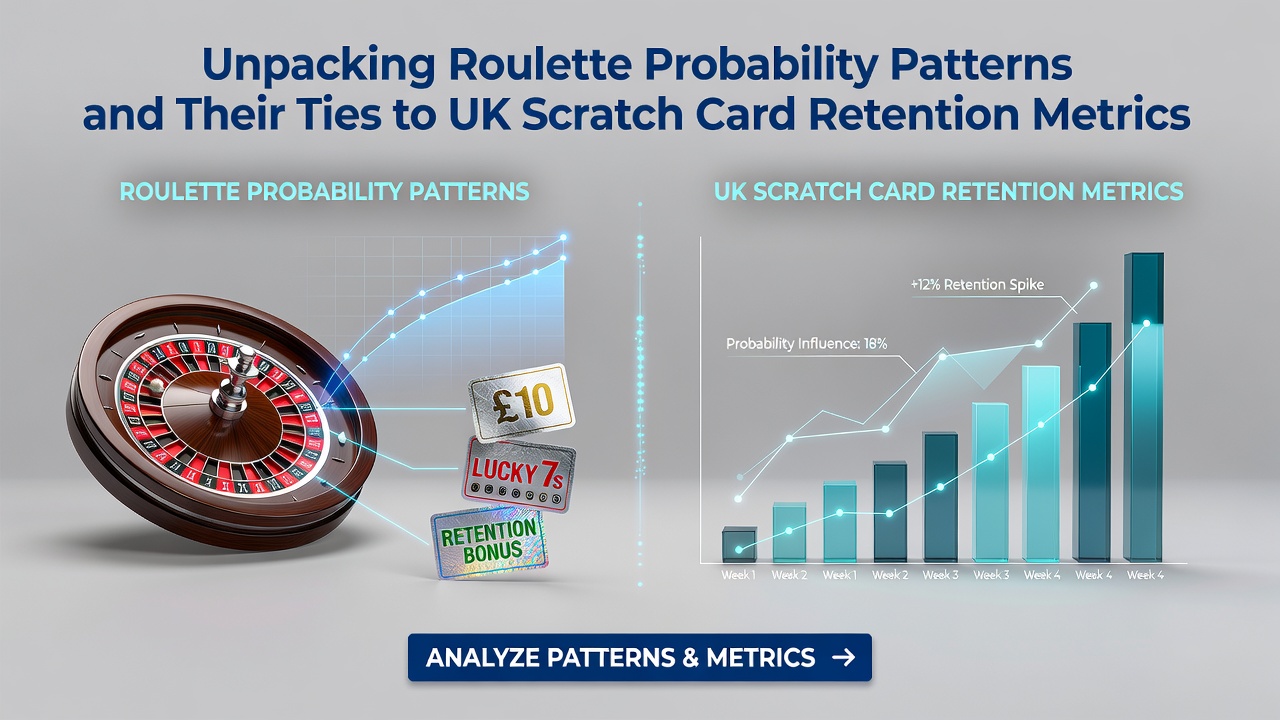
European roulette features 37 numbered pockets with a single zero while American variants include an additional double zero for a total of 38 pockets and these structural differences produce house edges of 2.7 percent and 5.26 percent respectively according to standard mathematical breakdowns. Each spin remains independent so sequences of colors or numbers do not alter future outcomes yet players sometimes track apparent runs in attempts to identify trends. Data from various gaming analyses show that such tracking rarely shifts the underlying probabilities because the wheel resets with every turn.
Core Mechanics of Roulette Outcomes
Researchers calculate the probability of landing on a specific number at 1 in 37 for European wheels and 1 in 38 for American ones while bets on red or black carry an 18 in 37 chance in the single-zero format. Observers note that clustering effects appear in short sessions but these dissolve over larger sample sizes as confirmed through repeated simulations. In October 2026 analysts at international gaming conferences plan to present updated models that incorporate real-time wheel data from multiple operators to refine these probability maps further.
Take one researcher who examined thousands of spins across regulated venues and found no deviation from expected distributions beyond random variance. This independence principle extends to inside and outside bets alike so strategies relying on pattern recognition encounter consistent mathematical resistance. Equipment calibration and regulatory oversight maintain wheel integrity while software-based versions use certified random number generators to replicate the same statistical profile.
Retention Metrics in UK Scratch Card Products
UK scratch card retention refers to the rate at which purchasers return for additional tickets after an initial buy and figures from industry reports track metrics such as average tickets per player per month along with repeat purchase intervals. Studies indicate that instant-win games generate steady engagement through fixed prize structures and visible win frequencies yet actual return-to-player percentages vary by game design with many titles set between 50 and 70 percent. Those who monitor these products observe that retention often correlates with prize tier visibility and perceived win proximity rather than long-term mathematical expectation.
What's interesting is how demographic breakdowns reveal higher repeat rates among certain age groups while overall participation remains stable across economic cycles according to aggregated sales data. Manufacturers adjust ticket prices and prize ladders to sustain interest and government statistics from non-UK sources help benchmark these patterns against international counterparts.
Connecting Probability Awareness to Player Persistence
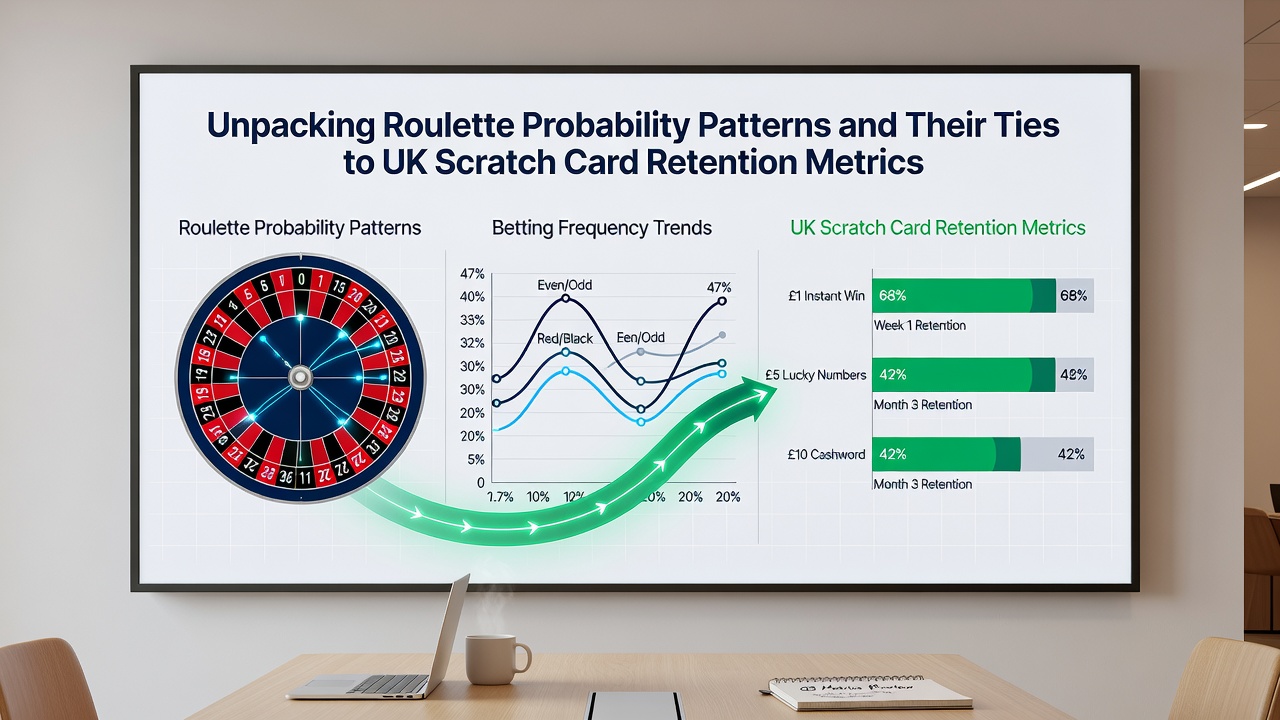
Analyses from academic institutions have examined whether exposure to roulette-style probability education influences scratch card repurchase behavior and early findings suggest modest effects on session length when players receive clear information about odds. One study revealed that individuals who reviewed independent outcome explanations tended to space out purchases more evenly compared with control groups though overall spend volumes showed limited change. Such research draws from university datasets and points to shared cognitive factors like near-miss perception that appear across both game types.
But here's the thing: retention in scratch cards often hinges on immediate visual feedback while roulette sessions unfold over multiple decisions so direct equivalence remains limited. External reports from the Australian Institute of Health and Welfare highlight broader gambling participation trends that include instant lottery products and these datasets allow cross-market comparisons without relying on single-region regulators. Australian Institute of Health and Welfare gambling reports provide longitudinal figures on player frequency that researchers cross-reference with probability studies elsewhere.
Another source comes from the National Council on Problem Gambling which compiles behavioral data across North American markets and offers context for how random outcome games maintain engagement levels over time. National Council on Problem Gambling resources include summaries of retention influences that apply to both table games and instant-win formats. Observers note that October 2026 workshops scheduled by international research networks will likely revisit these interconnections using fresh datasets from multiple jurisdictions.
Statistical Overlaps and Measurement Approaches
Probability models applied to roulette can illustrate expected value calculations that parallel the fixed return rates printed on scratch cards yet the former involves sequential decisions while the latter delivers instant resolution. Data indicates that players who understand house edge concepts across both formats sometimes exhibit steadier play intervals though aggregate retention statistics remain driven by product availability and marketing reach. Those who've studied these dynamics emphasize sample size importance because small session counts can mask the convergence toward theoretical probabilities.
Case examples from regulated markets demonstrate that transparency around odds correlates with stable rather than declining retention when paired with responsible play tools. Researchers discovered through controlled trials that visual probability aids reduced chasing behavior in simulated roulette while similar messaging on scratch card packaging produced comparable spacing of purchases. These patterns emerge consistently in third-party audits that track both game categories side by side.
Conclusion
Probability structures in roulette rest on fixed pocket distributions and independent trials whereas UK scratch card retention metrics reflect repeat purchase rates shaped by design and visibility factors. Connections between the two appear through shared elements of random outcome perception and player decision patterns documented in cross-disciplinary studies. Continued data collection through 2026 and beyond will clarify how educational interventions around odds influence persistence across instant and table-based games in various regulatory environments.